Understanding & Improving the Vacation Rental Shopping Experience on Expedia (VR on BEX)
PROJECT SCOPE
Role: Quantitative UX Researcher (CX Measurement, Expedia Group)
Timeline: Q1 2026 (DUET data June–Dec 2025)
Platforms: Web (desktop + mobile) & App – Brand Expedia (BEX) Vacation Rentals
Methods: DUET CX metric analysis, large-scale survey analysis, UX benchmarking, statistical modeling
Collaborators: CX Measurement, Product Analytics & Visualization Engineering, Yield & Analytics (PAX), Product & Design
Overview
Brand Expedia’s vacation rental (VR) experience is a key growth lever, but we lacked a clear, comparative view of how it performed against travelers’ alternatives. I led a cross-site benchmark to evaluate how effectively BEX helps travelers discover, evaluate, and trust vacation rentals relative to competitors, and to identify the highest-impact UX opportunities for the VR surface. Expedia is expanding its vacation rental (VR) offerings, but VR shopping introduces more variability and complexity than hotel stays. To monitor traveler sentiment and identify experience gaps, I led a multi‑quarter quantitative research initiative using DUET—Expedia’s real‑time UX metric that measures Delight, Usability, Ease, and Trust. The goal of this work was not to assess specific UI elements, but to build a robust measurement framework, evaluate changes in experience quality over time, and identify structural issues in how Expedia understands VR intent.
Context
Brand Expedia (BEX) web experience for vacation rentals (segmented further into two segments: intent & qualified).
Key flows: discovery (search/landing), evaluation (SRP + PDP), and reassurance (reviews, policies, fees, location).
DUET is Expedia Group’s real‑time traveler experience metric designed to quantify the quality of a digital experience through four core dimensions: Delight, Usability, Ease, and Trust.
It was developed using industry‑standard UX measurement frameworks and validated with large‑scale traveler data.
Research Questions & Approach
1 — Research Questions
I structured the analysis around four core questions:
1. How is traveler sentiment toward VR evolving quarter‑over‑quarter?
(Using DUET as a continuous benchmarking tool)
2. How do VR "Qualified" and "Intent" segments differ in sentiment and behavior?
(And does our current segmentation actually reflect VR interest?)
3. Where in the traveler journey does the experience improve or deteriorate?
(Segment × device × touchpoint analysis)
4. What high‑level friction themes consistently emerge across feedback channels?
(Structured coding of open‑ended responses)
2 — Methodological Approach
To triangulate insights, I integrated three quantitative data streams:
1. DUET survey responses
Collected via site intercepts and email, mapped to traveler journey stages (SRP, PDP, Checkout, post‑booking, post‑trip).
2. Clickstream behavioral signals
Used to classify travelers into:
VR Qualified (based on trip characteristics)
VR Intent (based on VR‑specific interactions)
3. Transactional data
Linked DUET respondents to booking records to understand:
Which profiles predict actual VR booking
Where cancellations spike
How representative the response populations are
Analytical techniques
1. Funnel analytics
To evaluate the Qualified → Intent pipeline and identify where travelers disengage.
2. Cross‑segment score modeling
Comparing DUET across:
Qualified vs. Intent users
Vacation rentals vs. Conventional Lodging
Device types
Journey stages
I used effect sizes (Cohen’s d), confidence intervals, and significance testing to separate directional differences from meaningful gaps.
3. Temporal comparison
Quarter‑over‑quarter modeling to quantify change and identify where scores improved or deteriorated.
4. Thematic analysis of open‑ended feedback
I coded responses into top UX friction themes and quantified prevalence across segments and devices.
5. Profile validation
Using odds ratios, regression modeling, and booking data to evaluate whether the existing VR Qualified definition predicts actual VR behavior.


Key Findings
1. Sentiment improved, but the funnel broke.
Across Q4, Delight, Usability, Ease, and Trust all increased slightly across devices. However, only ~7% of Qualified travelers progressed to Intent, compared to 27% in the prior benchmark.
Interpretation: The segmentation framework, not the product experience, was driving the collapse. The Qualified cohort was too broad to reliably represent VR‑interested travelers.
2. Experience quality declines as travelers show real intent.
Across all devices, Intent travelers scored lower than Qualified travelers on every DUET dimension. Even when differences were statistically small, the pattern was consistent: Interest increases → perceived friction increases.
This signals deeper issues in the late‑stage VR shopping journey (pricing clarity, policies, trust cues), not in initial discovery.
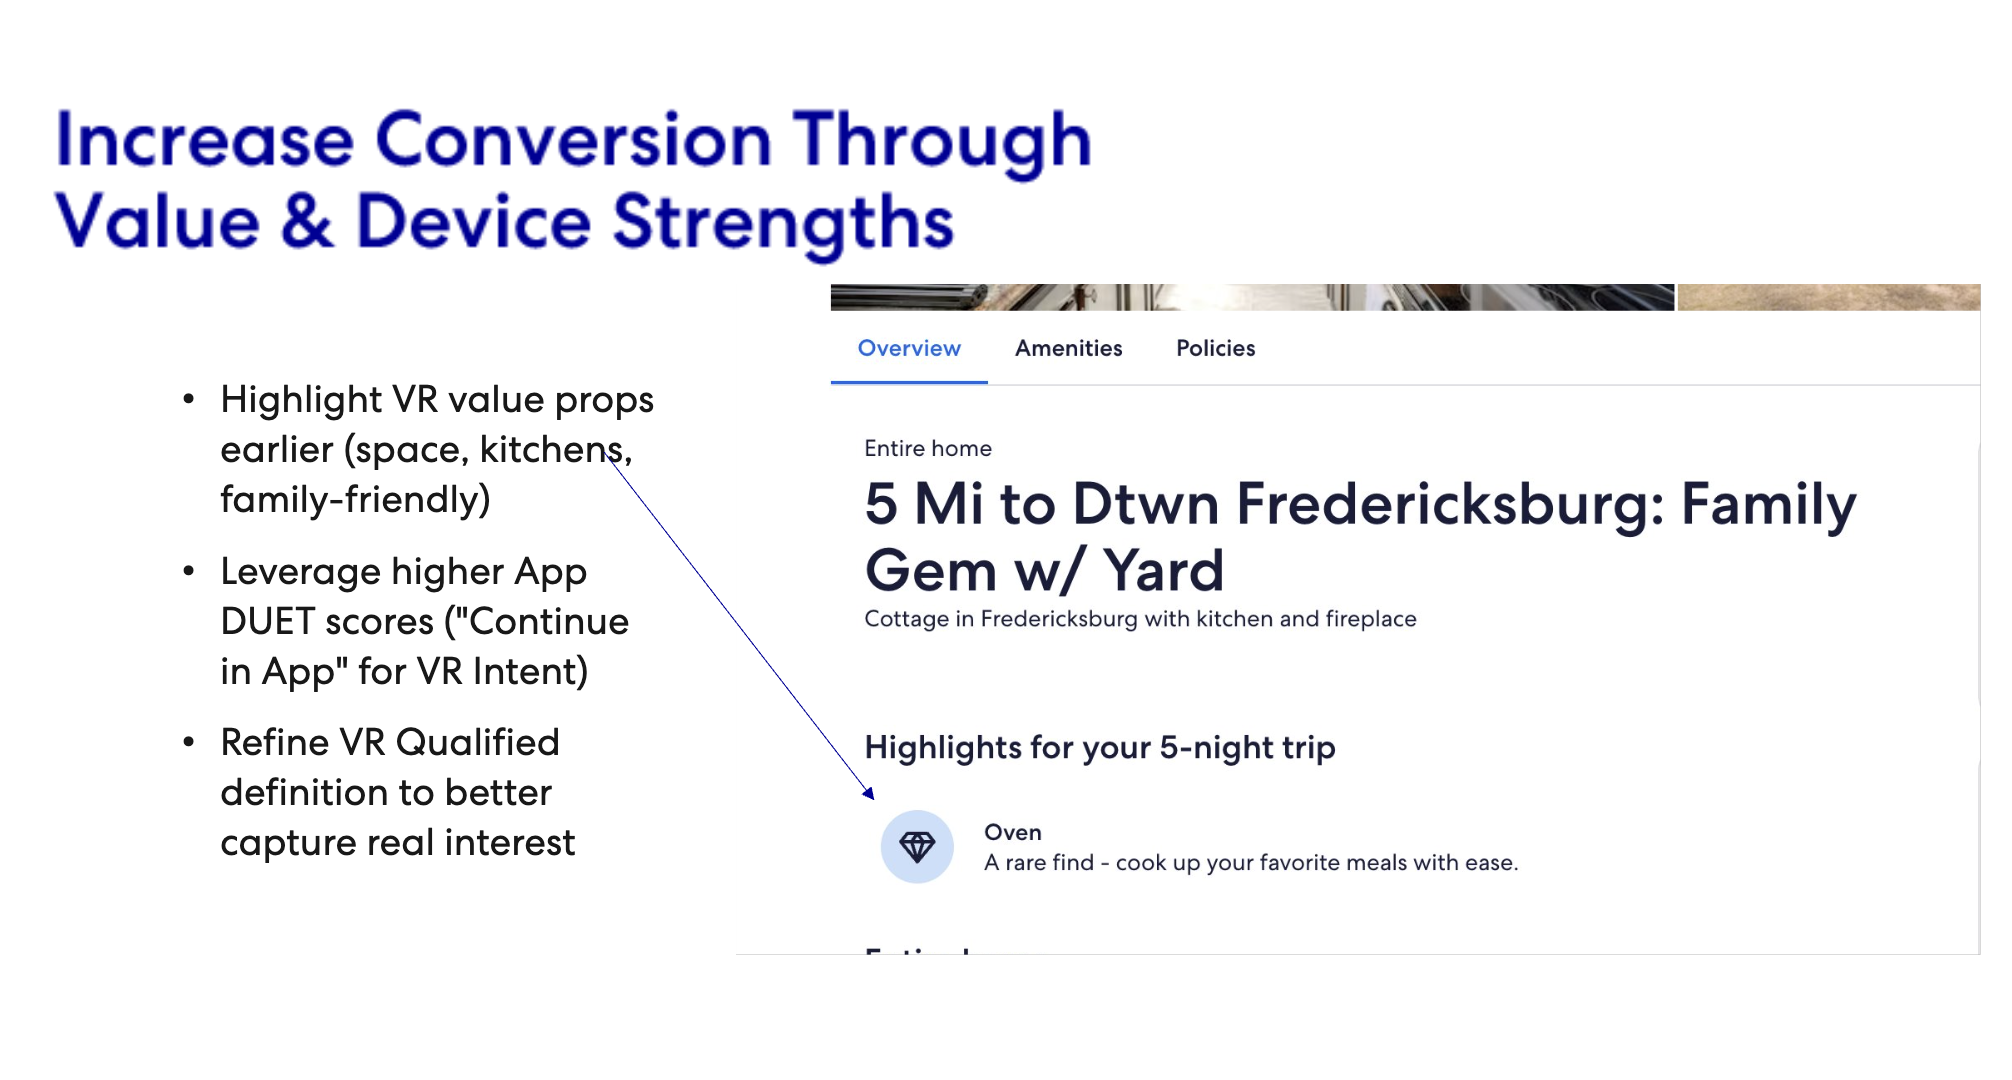
3. Device matters — App travelers consistently reported the best experience.
App outperformed desktop and mobile web across Qualified and Intent groups, especially on Trust and Ease.
Strategic implication: The App environment is a conversion opportunity for high‑intent VR shoppers.
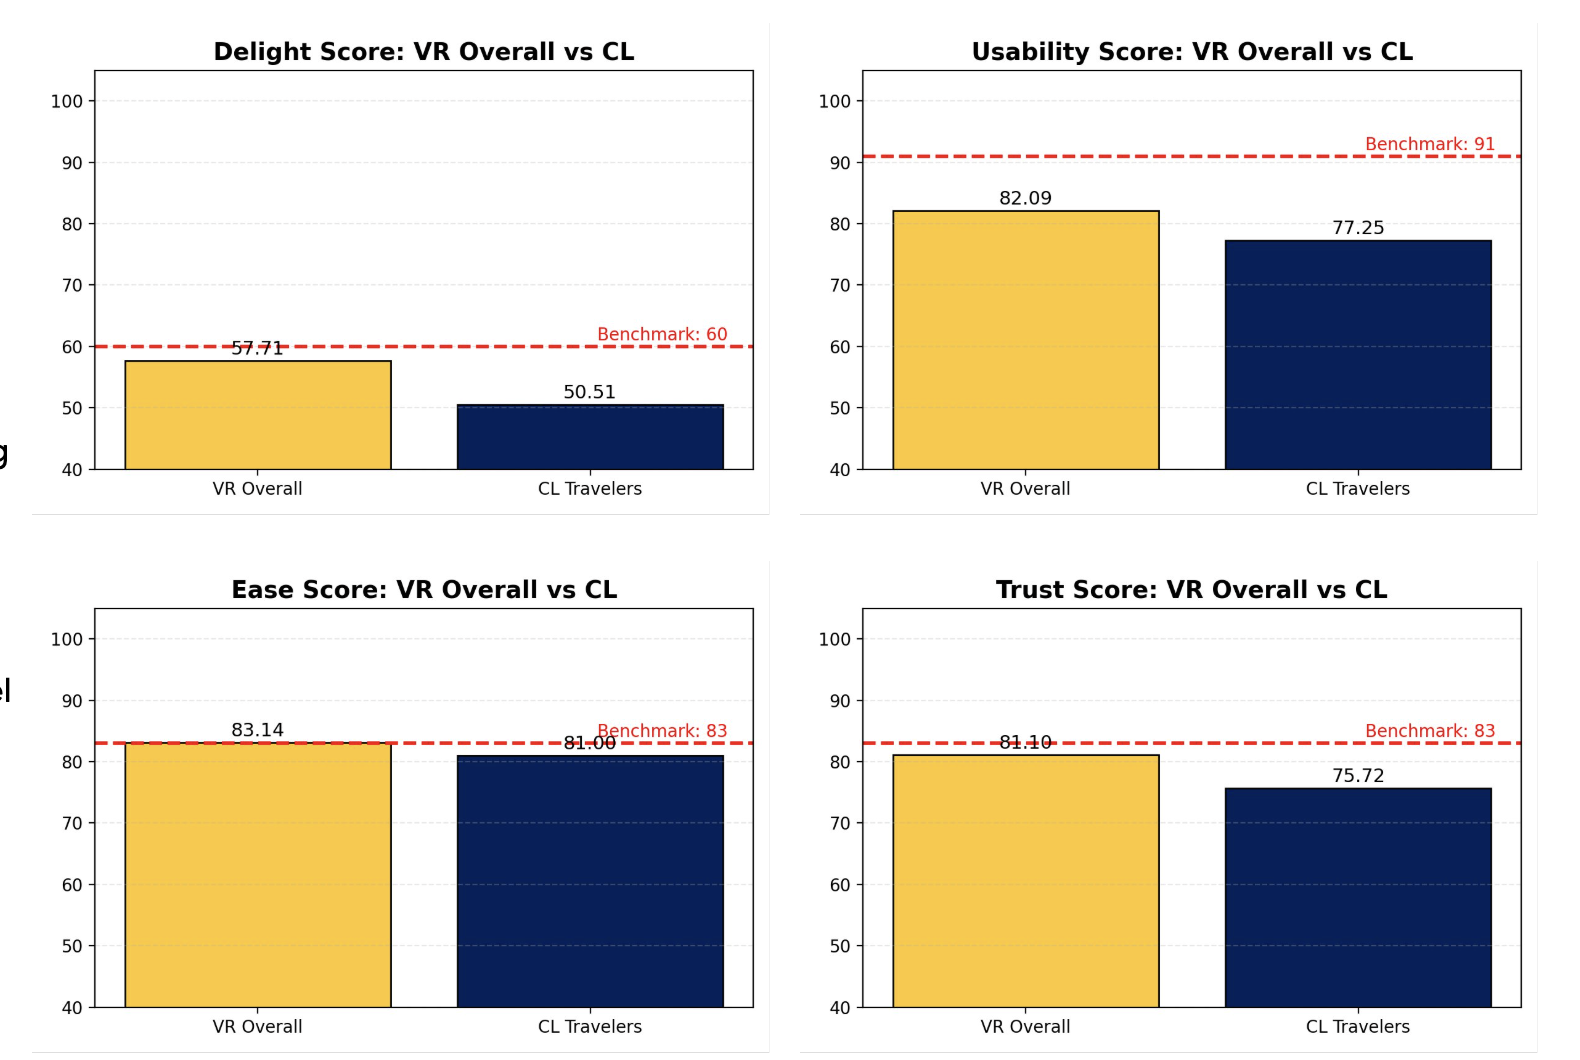
4. VR outperforms conventional lodging — despite falling short of benchmark goals.
After normalizing for device, touchpoint, and loyalty level:
VR scores were higher than Conventional Lodging on all DUET components
But still below EG’s benchmark for an excellent experience
Why this matters: The VR product space is strong but under‑optimized.
Open-Text Feedback themes consistently pointed to system-level friction
Rather than UI-specific complaints, the top issues reflected structural experience gaps:
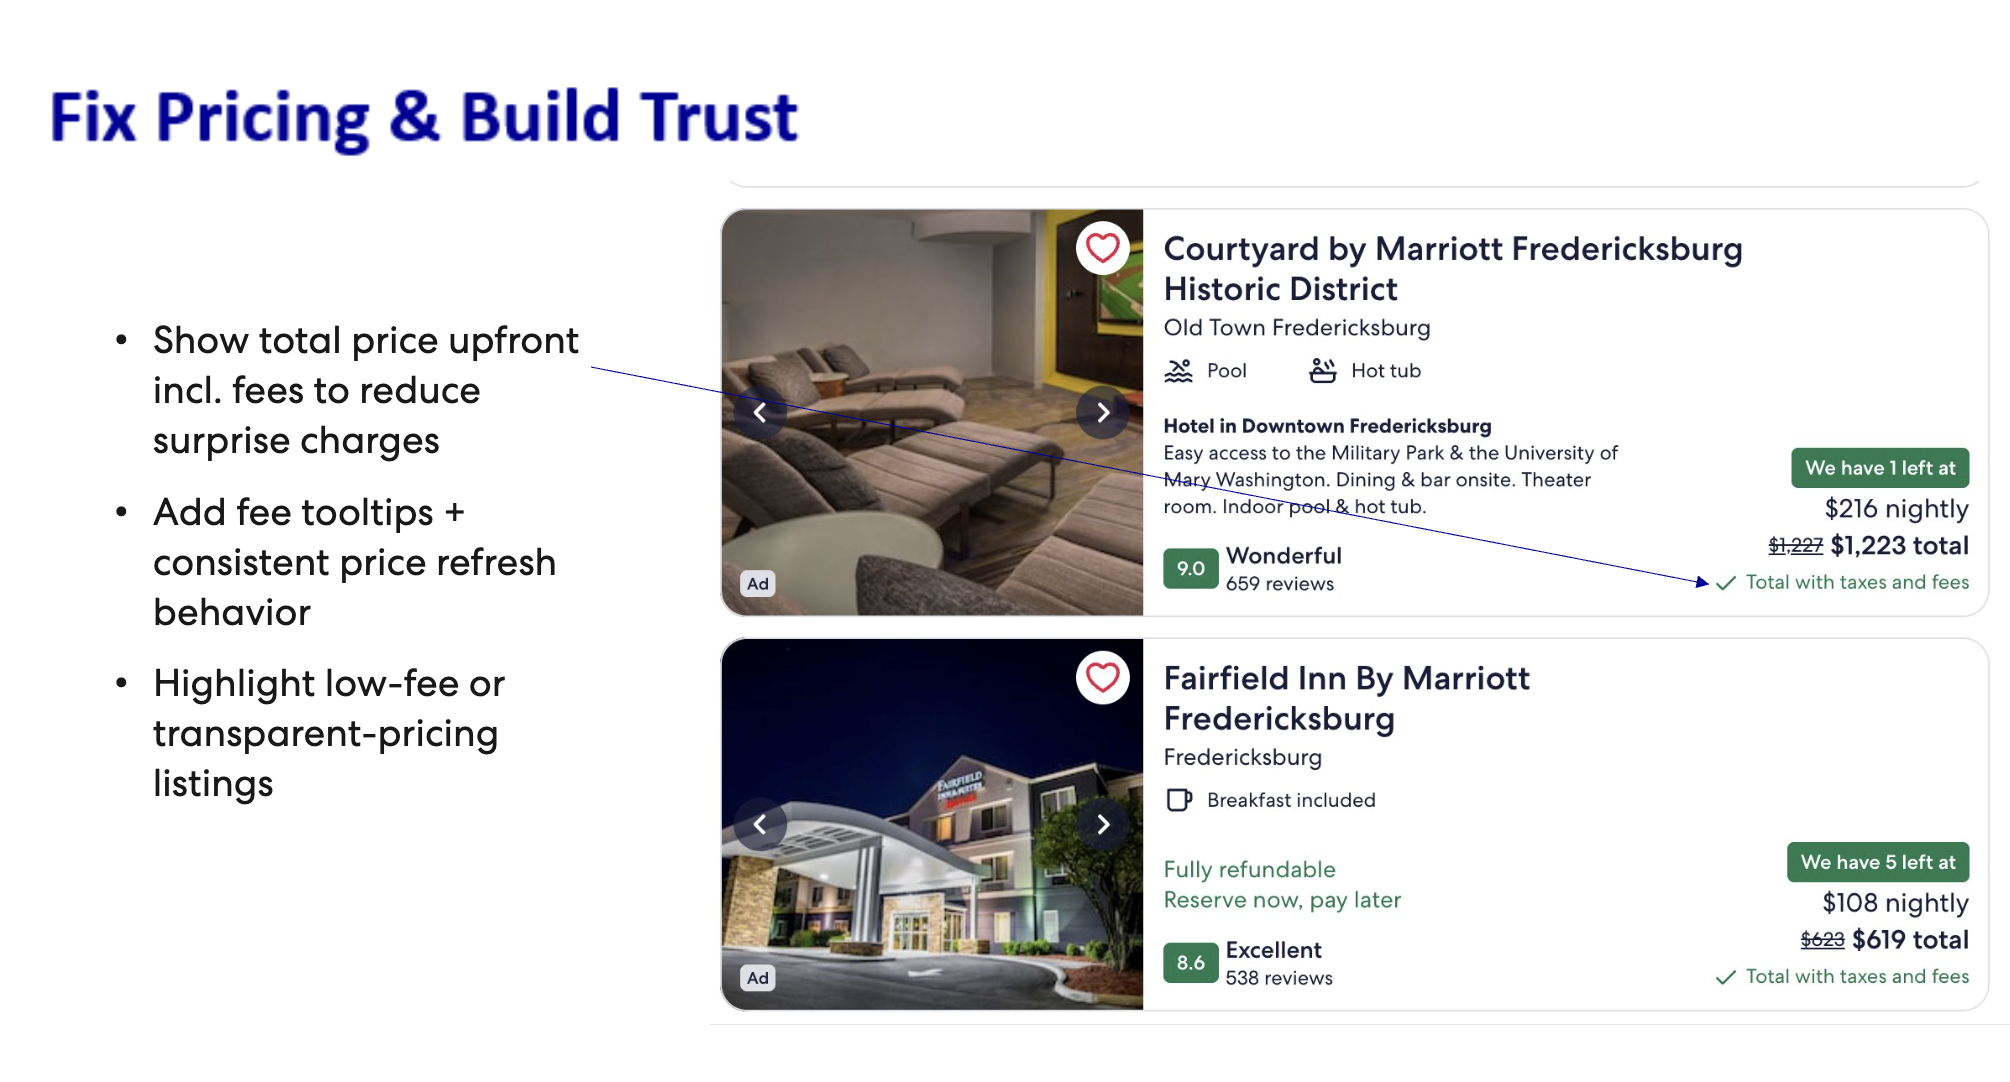
1. Pricing & fee transparency
Surprise totals, inconsistent fee presentation, and mid‑flow price changes undermined trust.
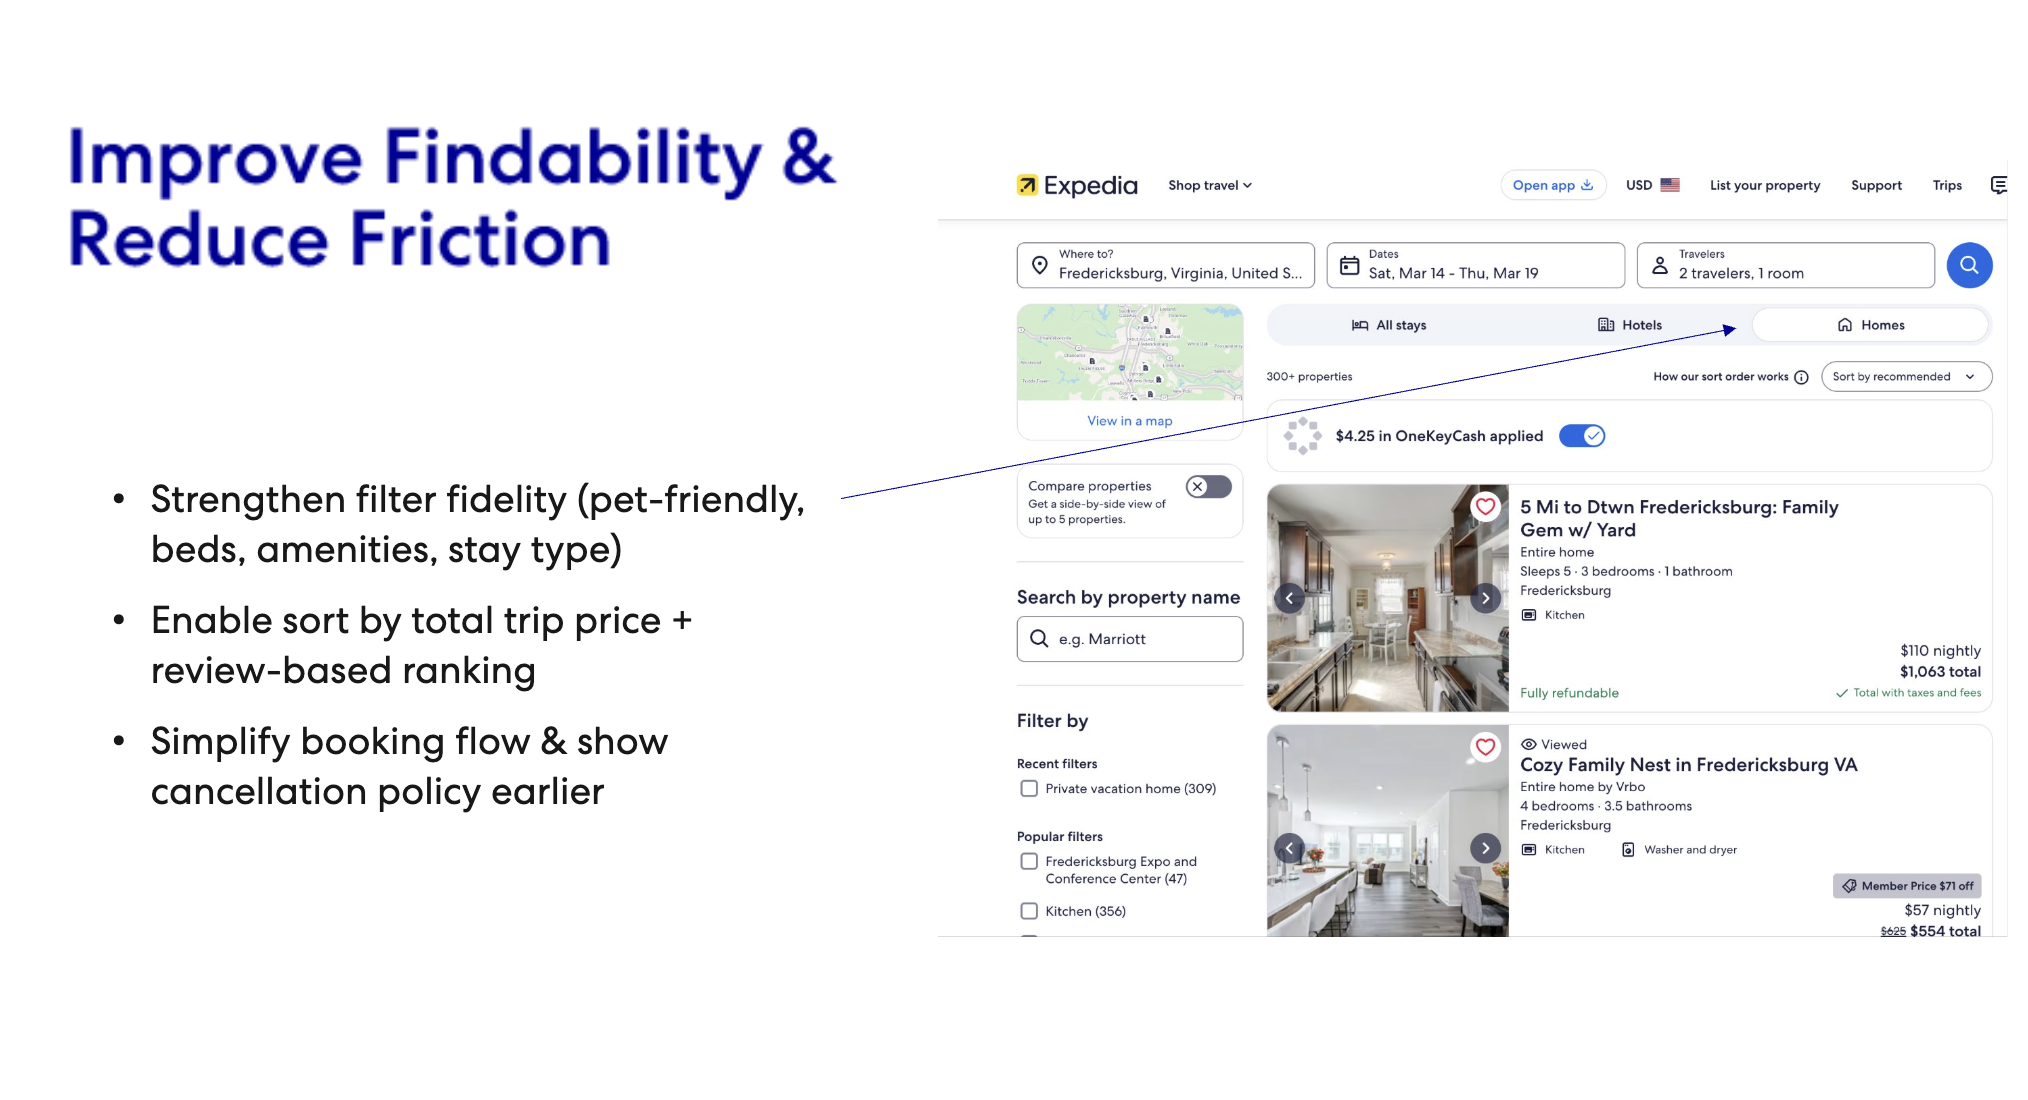
2. Navigation complexity & information overload
Travelers struggled to refine searches, filter reliably, and find suitable options quickly.
3. Inventory gaps or mismatches
Limited quantity or quality of VR listings in some markets pushed travelers back to hotels or competitors.
4. Booking clarity
Travelers were unsure whether they were “instantly booking” or “requesting,” and cancellation policies were often discovered late.
6. Profile analysis revealed a major measurement problem
Using booking data, I evaluated whether travelers who met the VR Qualified profile actually booked VRs.
Findings:
Qualified travelers were 40–44% less likely to book a VR than Intent travelers.
They were also more likely to cancel when they did book.
Conclusion:
The Qualified profile was not predictive of true VR interest, and in some cases misleading.
This was a critical insight:
Before optimizing the VR experience, we needed to fix how we identify VR‑interested users.
Strategic Impact
This analysis established the first VR‑specific measurement framework within Expedia’s CX organization, leading to:
A cross‑functional initiative to redefine the VR Qualified profile
Prioritization of pricing transparency improvements
Product efforts to strengthen PDP clarity, trust cues, and cancellation visibility
Development of a roadmap for filter fidelity and search refinements
A proposal for App‑based conversion pathways (e.g., “Continue in App”)
Inclusion of VR‑specific filters in CX Pulse dashboards